The dataset is available from multiple sources:
Dataset description
After downloading the dataset, you will have 200 TIFF files (cropped regions of interest from 200 individual tumor cases), and a database. The TIFF files have been converted to standard RGB profiles using the ICC profiles that the scanners provided, where available.
The database is available as sqlite (SlideRunner format) and as json (MS COCO format). For an example of how to interpret this format, please see the notebook below.
The assignment of the scanners to the files is as follows:
001.tiff to 050.tiff: Hamamatsu XR
051.tiff to 100.tiff: Hamamatsu S360 (with 0.5 numerical aperture)
101.tiff to 150.tiff: Aperio ScanScope CS2
151.tiff to 200.tiff: Leica GT450 (only images, no annotations provided for this scanner)
To get a first overview of the data, we recommend our short paper preprint on arxiv:
Quantifying the Scanner-Induced Domain Gap in Mitosis Detection [arXiv.org preprint]
Getting started: The notebook
To get you started, there is an explanatory notebook on Google Colab that we really recommend for first steps:
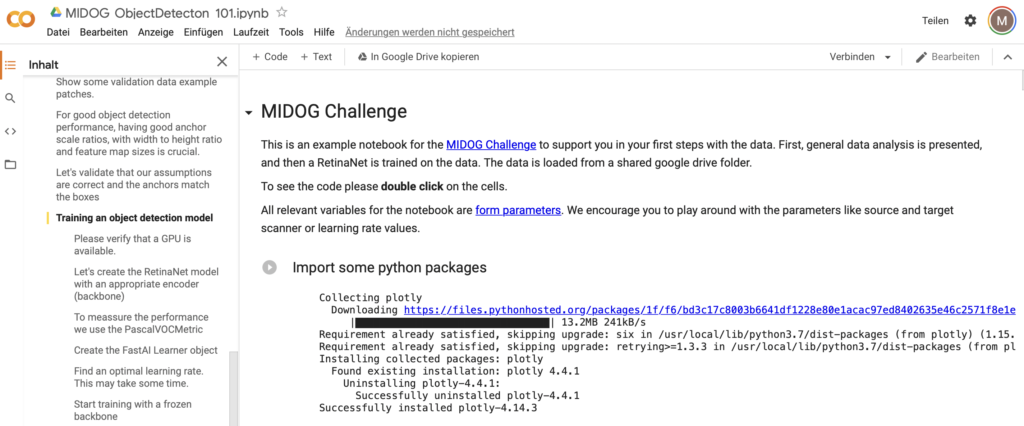
The notebook comprises the following:
- Statistical overview of the data set
- An in-depth view into the dataset
- Training a RetinaNet using the dataset with fast.ai (pytorch)